I’ve already put out there that “Que est Veritas” is a major theme in my professional and personal life. Let’s take a look on something that appears relatively uncomplicated at face value. The temperature in my house.
If I wanted to know the temperature in my house, I could walk up to the thermostat and look at the reading. In today’s connected digital world, I could simply bring up the Google Nest app on my phone and inspect it without climbing a flight of stairs. It’s set at 72 and the indoor air temp is 72. Great. But hey, I’m an engineer. I want to know what’s going on behind the scenes. Let’s take a look.
So the premise here is that one measurement from one sensor really doesn’t tell me much. I mean it’s a good starting point and we unconsciously do our own sanity check against whatever is displayed. If it says “72” but we are sweating or freezing, we are less likely to believe what the thermostat says. Technically, somewhere in that HVAC system is one or more temperature sensors that have a published accuracy. I could disassemble the thermostat and hope to find those sensors. That would be a lot of trouble. I’m an engineer. Let’s do a little project.
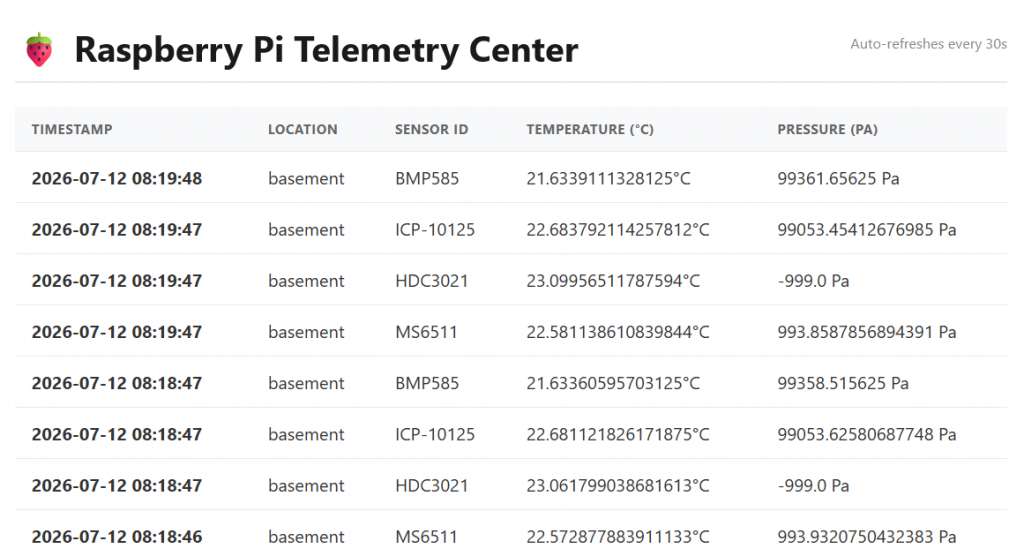
What if I used some embedded sensors that I got from Mikroelectronika (https://www.mikroe.com/ ), connected them to a Raspberry Pi single board computer (SBC) and start measuring the temperature? Well I did just that. The journey to creating python drivers, interacting with the sensors and publishing it to a website and storing it in a database deserves its own treatment but I did it. Yes, it was far more complicated that I originally thought but I learned A LOT. And it keeps me out of the bars. I’m a little proud of my work so here’s a snapshot of the simple flask app I built to display the text data.
Yeah, I know. So what.
But let’s inspect the temperature data. First – the measurements for these 4 different sensors go out to many significant figures! Do I really need that much data? Likely not. But if I limit myself to two decimal places, we find that these sensors differ in their estimation of the temperature. Que est veritas? After inspecting these data we could infer that the HDC3021 sensor is always higher than the other three and discard that. But what if it was closer to truth then the others. **Sidebar – in human interactions, like these sensors, truth often derives from experience. Philosophically, truth is truth regardless of what you feel.**
Let’s take a look at this data graphically – sometimes a different view can help us suss out new information and perspective.
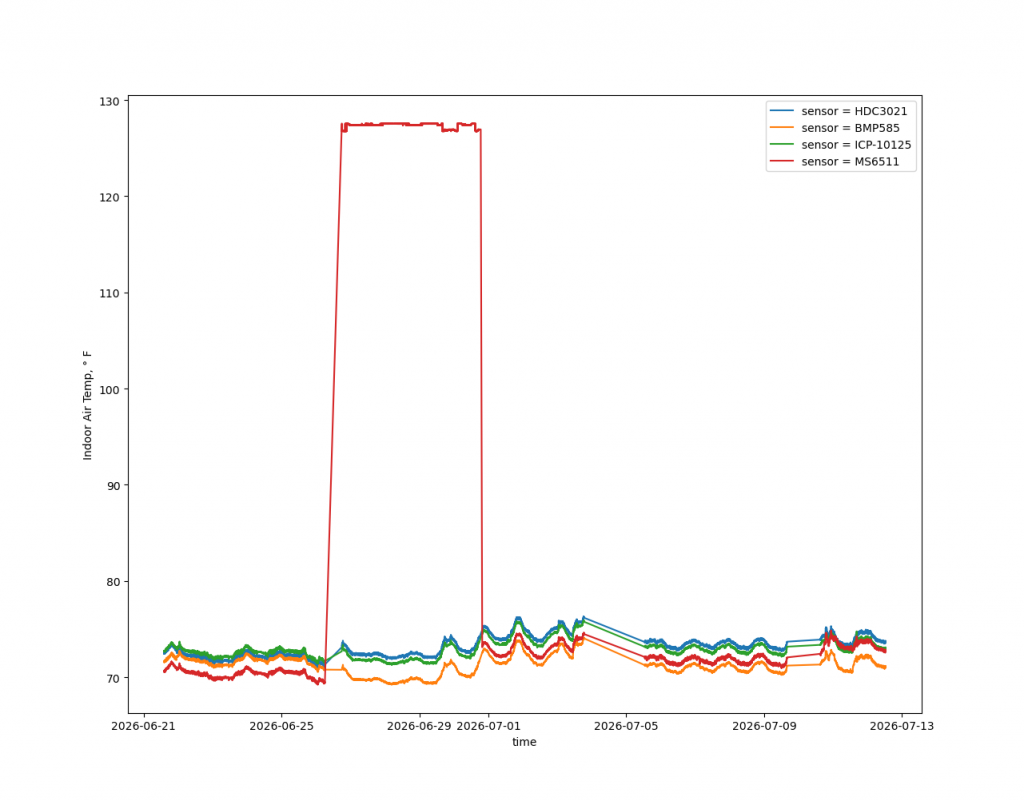
This plot presents temperature data taken from a dataset of sensor measurements taken every 60 seconds. It’s a perfect dataset for new data science students, it is not complete (I had some power outages), noisy, and dirty. Munging this data was fairly straight forward (thank you Python and Pandas!). Let’s zoom in on the most recent data and see what we can find.
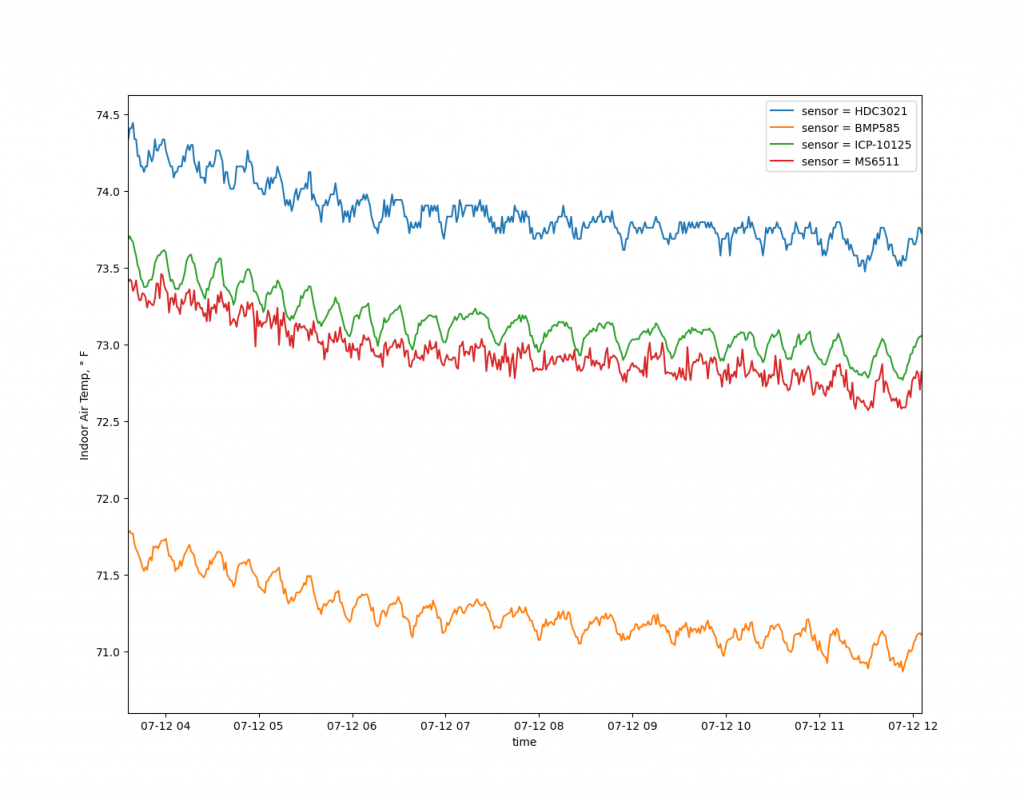
The first thing we notice is that the data noisy and jagged and is present on all sensors. This is likely the a/c and or fan kicking in to cool or dehumidify the air. Two sensors are closely correlated, one reads slightly higher while the BMP585 sensor is about two degrees lower than the others. FWIW the temperature upstairs is set at 72 degrees and the unit is allowed to cooler 2 degrees lower to dehumidify the air. So what’s the the truth temperature? More next post.